
ixian-bench: physical AI performance, measured
Compare physical AI models, hardware, and execution paths—with the measurements and test conditions behind every result.
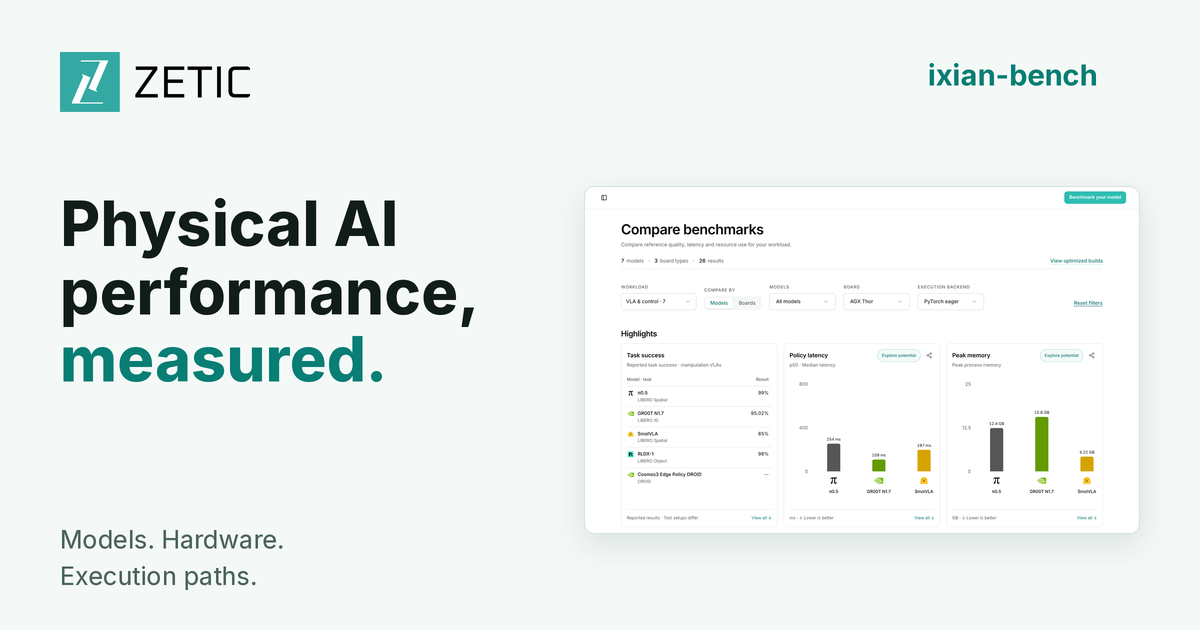
The question we hear most from robotics teams is some version of "okay, but how does it run on my board?" A model can look great in a paper and still be too slow or too heavy for the computer inside the robot. Getting that answer usually means setting up the board and measuring it yourself.
The answer depends on three things together: the model, the hardware it runs on, and the execution path, which is how the model actually runs on that hardware (the runtime or compiler, the precision and the settings).
Change any one of them and real-world performance changes. The model and the board usually get the attention, but even after a team has chosen both, the execution path can still be improved.
ixian-bench is a free public site that shows how physical AI models perform across all three, on the hardware inside robots. Pick a model and see how it runs on each board and execution path, or pick a board and compare models on it.
Results cover latency, memory, energy per inference and task success, and each one comes with the setup that produced it. The goal is to help you understand your options and make a deployment decision, with optimization and validation as the next step when you need them.
One model, four setups
Here's why the execution path matters. We ran π0.5 on two Jetson boards, each in two ways: PyTorch eager (the default way to run a PyTorch model) and torch.compile (PyTorch's built-in compiler). One model, four setups:
From the slowest setup to the fastest, the same model is about 7x apart. Moving from Orin to Thor accounts for 3.7x (both in eager). But staying on the same board and changing only the execution path gives 2.4x on Orin and 1.9x on Thor. The model didn't change, and neither did the hardware.
Energy fell along with latency. The fastest setup, Thor with torch.compile, also used the least energy per call of the four, because each call finished sooner.
Each comparison holds only under its own conditions, so every row opens to its Method, with the implementation, precision and test settings behind it.
Task success sits next to speed for the models that have been evaluated. These are reported results, and the suite and test setup differ from model to model (LIBERO Spatial for SmolVLA, LIBERO Object for RLDX-1), so the scores don't compare directly across models.
Put a budget on it and the comparison becomes a decision. Say your robot needs π0.5 to answer in under 200 ms. Of the four setups, only Thor with torch.compile clears it (132 ms), and it also uses the least energy per call.
On Thor, the board was never the problem: the default path misses (254 ms), and a better execution path gets there. On Orin, neither path we measured gets close (394 ms at best), so the choice is a bigger board or a better execution path than these two.
In general, a comparison like this points a team to one of three moves:
- A bigger board, when no execution path on the current board gets close to what the robot needs.
- A different model, when a smaller one reaches the task success you need with less latency and memory.
- A better execution path on the hardware you already have, when the gap is small enough to close without changing the board or the model. It's the only option that keeps both the robot's hardware and the model you've already validated.
Quality, memory and energy decide which move is acceptable. A faster setup only counts if task success holds and the model still fits the robot's memory and power budget. ixian-bench isn't a leaderboard: we publish the measurements and the conditions, and you make the call.
How we measure
The full method is on the Methodology page. When you compare results, these are the parts that matter:
- Latency is end to end, from the start of preprocessing to the end of postprocessing.
- Each number states what it covers: a policy call, a frame interval or an action chunk. Both sides of a comparison should cover the same thing, and when they don't, the row says so.
- If something wasn't measured, it says Not reported. It's never shown as zero or borrowed from another row.
Where it starts, and what's next
The first results are VLA and control models such as π0.5, GR00T, SmolVLA and RLDX-1, on NVIDIA Jetson boards like AGX Thor, AGX Orin and Orin Nano. The site is built for more than VLAs: vision, depth estimation, point cloud and decision models already have their own workload categories on the site, waiting for their first results.
You can help set the order. In the Build with us section, you can vote on the robot tasks we benchmark next.
When your current setup falls short
Sometimes the baseline doesn't meet a team's requirements. The policy call is too slow for the control loop, or the model doesn't fit the memory or energy budget.
That's where ZETIC comes in. We improve the execution path on your target hardware, then validate the result against your quality goals, so a speedup only counts if task success holds.
You can see what that looks like on the site. Optimized builds puts ZETIC's runs next to the reference results on the same board, labeled separately, each with its precision, quality result and measurement conditions.
On AGX Thor, our π0.5 build runs a policy call in 26.08 ms against 253.7 ms in PyTorch eager, 9.7x faster, with zero closed-loop failures on LIBERO Spatial.
If your model or board isn't on the site yet, including a fine-tuned version, the Benchmark your model form is the place to start.
Choose benchmark, optimize or both, then add your model or Hugging Face ID, your target board and your goals for latency, energy and memory. We agree on scope, then benchmark, optimize and validate against your baseline and quality targets.
Explore ixian-bench at ixian.zetic.ai